Note
Go to the end to download the full example code.
Quarter_car_example#
Quarter car example
Import necessary libraries#
import numpy as np
import matplotlib.pyplot as plt
from matplotlib.animation import FuncAnimation
Import from pymycar package#
from pymycar.Vehicle.car import MyCar
from pymycar.Vehicle.chassis import Chassis
from pymycar.Vehicle.suspension import Suspension, SimpleSuspension
from pymycar.Vehicle.wheel import Wheel
from pymycar.VerticalModels.models import VerticalQuarterCar
from pymycar.VerticalModels.exitations import sin_negative_part_exitation,sin_exitation
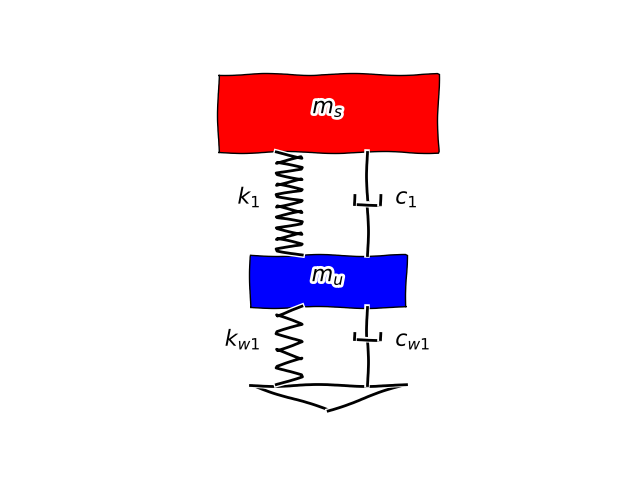
Definition of the car In this case the model to study is the quarter car model, so only the chassis, one one, and one suspension is needed. Note tht the effective mass of the quartes car correcpont to a quarter part of the mass defined of the chassis class.
chassis_class = Chassis(front_axle_to_com=None,
rear_axle_to_com=None,
front_track=None,
rear_track=None,
com_height=None,
mass=40*4,
inertia_x=None,
inertia_y=None,
inertia_z=None,
drag_coefficient=None,
lift_coefficient=None)
# Then the right front wheel is defined. By default the quater car model, takes
# the right_front_wheel as the quarter part to study.
right_front_wheel = Wheel(mass=10.0,
spin_inertia=None,
nominal_radius=None,
radial_stiffness=125560,
radial_damping=0.0,
nominal_vertical_load = None,
max_longitudinal_adherence=None,
max_lateral_adherence=None,
sidelsip_stiffness=None,
longitudinal_stiffness=None)
# Then the rright_front_suspension suspensions is defined. By default the quater car model, takes
# the right_front_suspension as the quarter part to study.
right_front_suspension = SimpleSuspension(stiffness=35000,
damper=2800)
# With this class is it possible to define the car class
mycar = MyCar(chassis=chassis_class,
left_rear_wheel=None,
right_rear_wheel=None,
left_front_wheel=None,
right_front_wheel=right_front_wheel,
left_rear_suspension=None,
right_rear_suspension=None,
left_front_suspension=None,
right_front_suspension=right_front_suspension)
def from_data(target_time):
defined_time = np.linspace(0, 2, 10000)
amplitude = -0.03
frequency = 5.556/3
aux = sin_negative_part_exitation(defined_time, amplitude, frequency)
defined_sol = np.interp(target_time, defined_time, aux)
return defined_sol
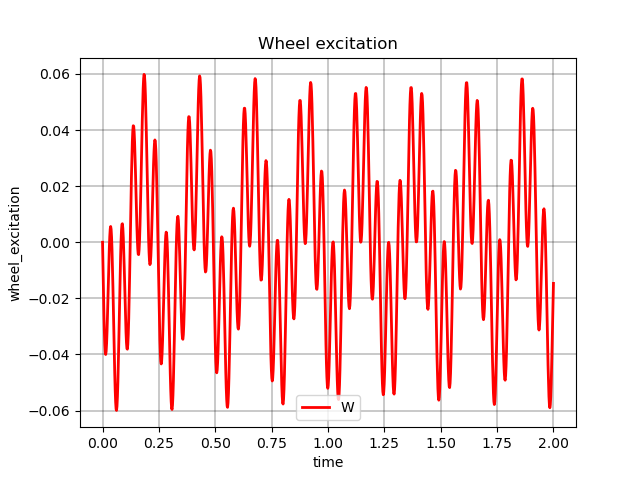
def eval_sin(t):
amplitude = -0.03
frequency = 5.556/3
frequency = 4.13766
return sin_exitation(t, amplitude, frequency) + sin_exitation(t, amplitude, 20.29155)
solver = VerticalQuarterCar(mycar, quarter_part="right_front", result_folder_name="results_quarter_car", path = None)
solver.time_points = np.linspace(0, 2, 1000)
solver.wheel_excitation = eval_sin
solver.natural_frequencies()
print(solver.natural_frequencies_hz)
solver.solve()
All specified files deleted successfully.
All specified folders and their contents deleted successfully.
All specified folders and their contents deleted successfully.
[ 4.13765916+0.j 20.29155038+0.j]

  message: The solver successfully reached the end of the integration interval.
  success: True
   status: 0
        t: [ 0.000e+00  2.002e-03 ...  1.998e+00  2.000e+00]
        y: [[ 0.000e+00 -2.370e-06 ... -4.385e-02 -4.592e-02]
            [ 0.000e+00 -6.745e-05 ... -5.185e-02 -5.216e-02]
            [ 0.000e+00 -4.585e-03 ... -1.088e+00 -9.775e-01]
            [ 0.000e+00 -9.657e-02 ... -3.586e-01  4.868e-02]]
      sol: None
 t_events: None
 y_events: None
     nfev: 6008
     njev: 0
      nlu: 0
fig, ax_w = plt.subplots()
ax_w.plot(solver.time, solver.wheel_excitation(solver.time), 'r-', linewidth=2.0, label="W")
ax_w.grid(color='k', linestyle='-', linewidth=0.3)
ax_w.set_xlabel('time' )
ax_w.set_ylabel('wheel_excitation')
ax_w.set_title('Wheel excitation')
ax_w.legend()

#fft_result = np.fft.fft(solver.wheel_excitation(solver.time))
#frequencies = np.fft.fftfreq(len(fft_result), len(solver.time)/1000)
<matplotlib.legend.Legend object at 0x7e5604469780>
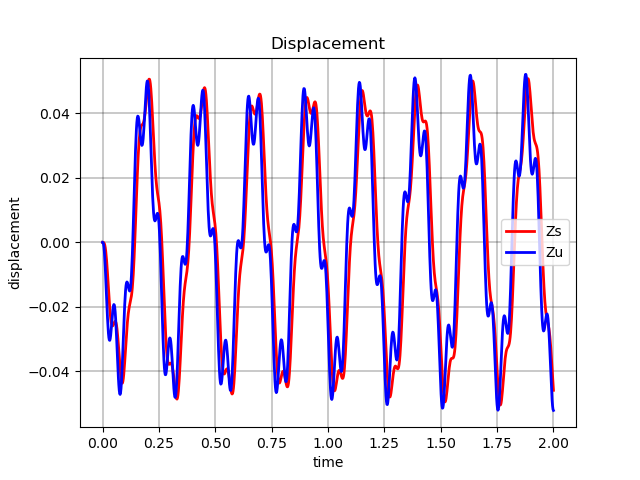
fig, ax_q = plt.subplots()
ax_q.plot(solver.time, solver.zs, 'r-', linewidth=2.0, label="Zs")
ax_q.plot(solver.time, solver.zu, 'b-', linewidth=2.0, label="Zu")
ax_q.grid(color='k', linestyle='-', linewidth=0.3)
ax_q.set_xlabel('time' )
ax_q.set_ylabel('displacement')
ax_q.set_title('Displacement')
ax_q.legend()
<matplotlib.legend.Legend object at 0x7e5606d85c00>
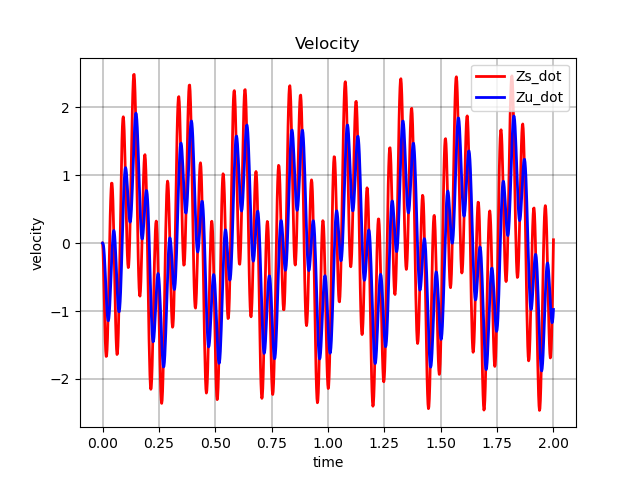
fig, ax_q_dot = plt.subplots()
ax_q_dot.plot(solver.time, solver.zs_dot, 'r-', linewidth=2.0, label="Zs_dot")
ax_q_dot.plot(solver.time, solver.zu_dot, 'b-', linewidth=2.0, label="Zu_dot")
ax_q_dot.grid(color='k', linestyle='-', linewidth=0.3)
ax_q_dot.set_xlabel('time' )
ax_q_dot.set_ylabel('velocity')
ax_q_dot.set_title('Velocity')
ax_q_dot.legend()

plt.show()
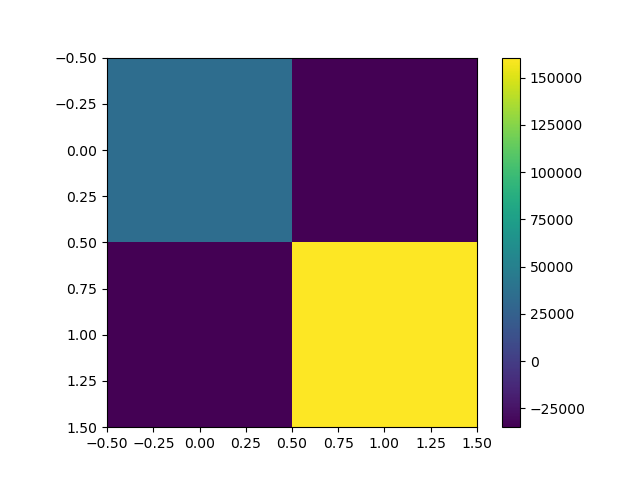
plt.imshow(solver.M)
plt.imshow(solver.C)
plt.imshow(solver.K)
plt.colorbar()

plt.show()
Total running time of the script: (0 minutes 0.545 seconds)