Note
Go to the end to download the full example code.
Double Whisbone#
#
#                    \\\
#                    \-/
#             UCA_REAR*
#                    /
#                   /
#   -----------    /
#    |       |    /
#    |       |   *----------*UCA_FRONT
#    |       |             /⁻\
#    |       |             ///
#    |       |
#    |       |
#    |       |        tierod_outer
#    |       |       *--------------------*TIEROD_INNER
#    |       |
#    |       |
#    |       |       lca_outer
#    |       |      *------------*LCA_REAR
#   -----------     \           /⁻\
#                    \          ///
#                     \
#                      *LCA_FRONT
#                     /⁻\
#                     ///
Name |
Description |
|---|---|
UCA_FRONT |
upper control arm front |
UCA_REAR |
upper control arm rear |
LCA_FRONT |
upper control arm front |
LCA_REAR |
LOWER control arm rear |
TIEROD_INNER |
tierod inner |
uca_outer |
upper control arm outer |
lca_outer |
lower upper control arm outer |
tierod_outer |
tierod outer |
import matplotlib.pyplot as plt
import numpy as np
import pyvista as pv

from pymycar.SuspensionKinematic.double_whisbone import double_whisbone_configuration_2
from pymycar.SuspensionKinematic.functions import get_wheel

from pymycar.Cad.Wheel.wheel import wheel_cad
from pymycar.Cad.Suspension.double_whisbone import whisbone_cad_configuration_2


# Points
data = {
    "UCA_FRONT": np.array([586.7, -314.5, 199.9]),
    "UCA_REAR":  np.array([930.7, -230.2, 244.2]),
    "LCA_FRONT": np.array([588.7, -384.2, 76.8]),
    "LCA_REAR": np.array([938.2, -191.2, 62.7]),
    "TIEROD_INNER": np.array([934.2,  -192.1,  81.2]),
    "ROCKED_PIVOT": np.array([901.0, -139.00, 399.0]),
    "ROCKED_PIVOT_AXIS": np.array([941.0, -139.00, 399.0]),
    "U_SPRING_MOUNT": np.array([901.0,  -29.50, 499.0]),
    "uca_outer": np.array([953.0, -474.2, 272.2]),
    "lca_outer": np.array([934.8, -514.7, 47.9]),
    "tierod_outer": np.array([1027.1, -513.7, 43.6]),
    "wheel_center": np.array([941.5, -580.2, 155.1]),
    "push_rod_outer": np.array([901.0, -379.00, 250.0]),
    "push_rod_inner": np.array([901.0, -139.00, 441.0]),
    "l_spring_mount": np.array([901.0, -130.20, 451.0])
}
Call the Solver#
solution, wheel_variables = double_whisbone_configuration_2(data,
                                           max_height_increase=50,
                                           max_height_decrease=20,
                                           height_step=1,
                                           save_to_txt=True,
                                           result_folder_name="double_whisbone_configuration_2",
                                           path=None)
All specified files deleted successfully.
All specified folders and their contents deleted successfully.
All specified folders and their contents deleted successfully.
/home/docs/checkouts/readthedocs.org/user_builds/pymycar/checkouts/latest/src/pymycar/SuspensionKinematic/functions.py:105: RuntimeWarning: The iteration is not making good progress, as measured by the
 improvement from the last five Jacobian evaluations.
  initial_guess = fsolve(residual, initial_guess, args=(wheel_center_z), fprime=jacobian,col_deriv=0,
/home/docs/checkouts/readthedocs.org/user_builds/pymycar/checkouts/latest/src/pymycar/SuspensionKinematic/functions.py:105: RuntimeWarning: The iteration is not making good progress, as measured by the
 improvement from the last ten iterations.
  initial_guess = fsolve(residual, initial_guess, args=(wheel_center_z), fprime=jacobian,col_deriv=0,
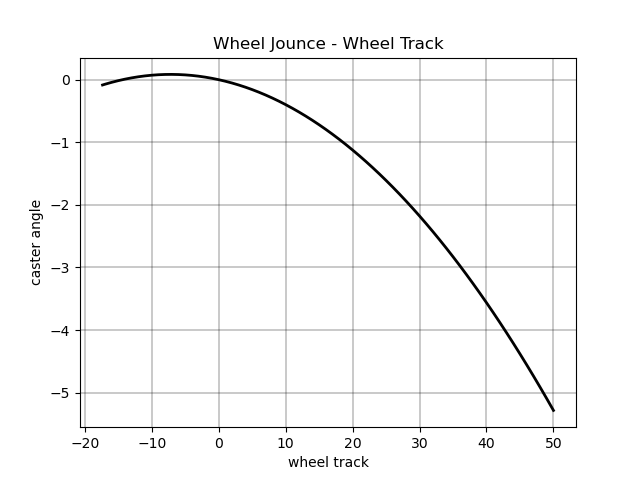
Plot: “wheel_track vs “wheel_jounce”#
fig, ax = plt.subplots()
ax.plot(wheel_variables["wheel_jounce"], wheel_variables["wheel_track"], 'k-', linewidth=2.0)
ax.grid(color='k', linestyle='-', linewidth=0.3)
ax.set_xlabel('wheel track')
ax.set_ylabel('caster angle')
ax.set_title('Wheel Jounce - Wheel Track')
Text(0.5, 1.0, 'Wheel Jounce - Wheel Track')
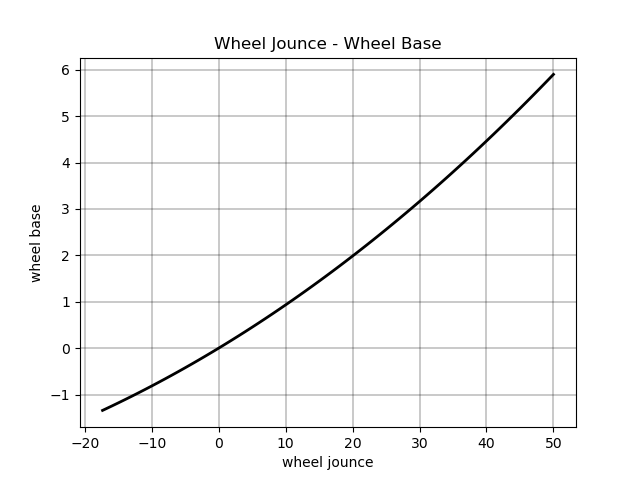
Plot: “wheel_base” vs “wheel_jounce”#
fig, ax = plt.subplots()
ax.plot(wheel_variables["wheel_jounce"], wheel_variables["wheel_base"], 'k-', linewidth=2.0)
ax.grid(color='k', linestyle='-', linewidth=0.3)
ax.set_xlabel('wheel jounce')
ax.set_ylabel('wheel base')
ax.set_title('Wheel Jounce - Wheel Base')
Text(0.5, 1.0, 'Wheel Jounce - Wheel Base')
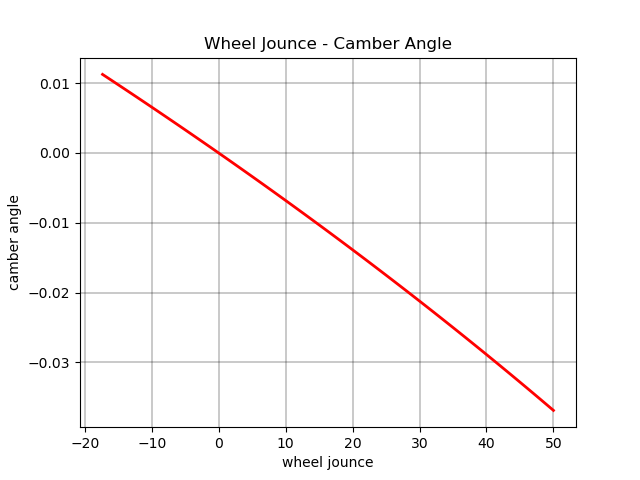
Plot: “camber_angle” vs “wheel_jounce”#
fig, ax = plt.subplots()
ax.plot(wheel_variables["wheel_jounce"], wheel_variables["camber_angle"],'r-', linewidth=2.0)
ax.grid(color='k', linestyle='-', linewidth=0.3)
ax.set_xlabel('wheel jounce')
ax.set_ylabel('camber angle')
ax.set_title('Wheel Jounce - Camber Angle')
Text(0.5, 1.0, 'Wheel Jounce - Camber Angle')
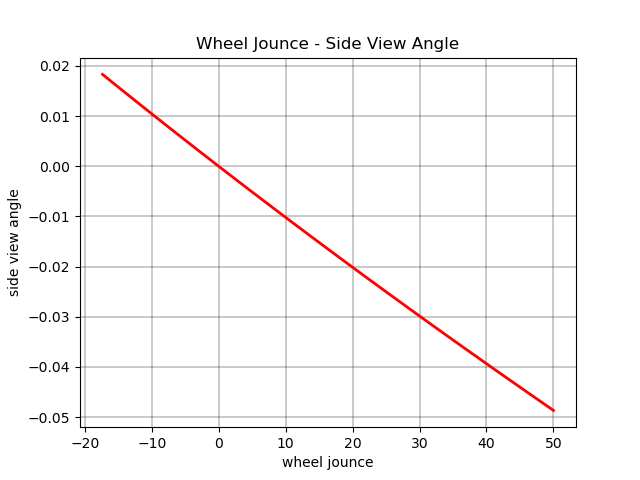
Plot: “camber_angle” vs “wheel_jounce”#
fig, ax = plt.subplots()
ax.plot(wheel_variables["wheel_jounce"], wheel_variables["side_view_angle"],'r-', linewidth=2.0)
ax.grid(color='k', linestyle='-', linewidth=0.3)
ax.set_xlabel('wheel jounce')
ax.set_ylabel('side view angle')
ax.set_title('Wheel Jounce - Side View Angle')
Text(0.5, 1.0, 'Wheel Jounce - Side View Angle')
Plot: “camber_angle” vs “wheel_jounce”#
fig, ax = plt.subplots()
ax.plot(wheel_variables["wheel_jounce"], wheel_variables["toe_angle"],'r-', linewidth=2.0)
ax.grid(color='k', linestyle='-', linewidth=0.3)
ax.set_xlabel('wheel jounce')
ax.set_ylabel('toe angle')
ax.set_title('Wheel Jounce - Toe Angle')
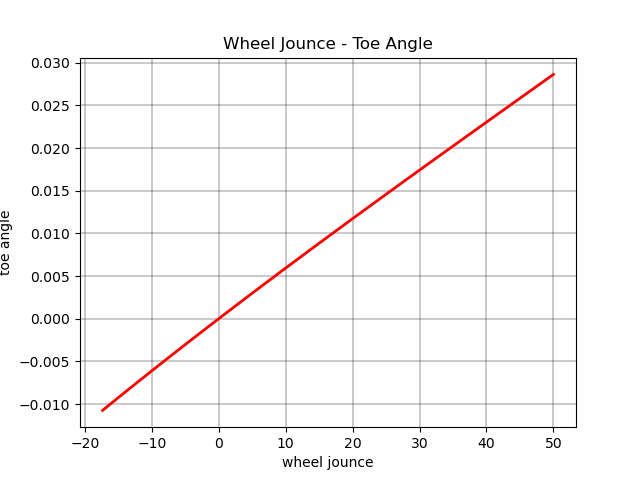
Text(0.5, 1.0, 'Wheel Jounce - Toe Angle')
Plot: “caster_angle” vs “wheel_jounce”#
fig, ax = plt.subplots()
ax.plot(wheel_variables["wheel_jounce"], wheel_variables["caster_angle"], 'g-', linewidth=2.0)
ax.grid(color='k', linestyle='-', linewidth=0.3)
ax.set_xlabel('wheel jounce')
ax.set_ylabel('caster angle')
ax.set_title('Wheel Jounce - Caster Angle')
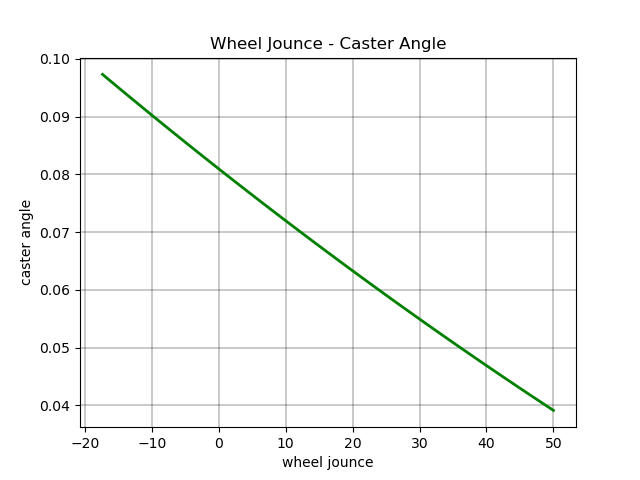
Text(0.5, 1.0, 'Wheel Jounce - Caster Angle')
Plot: kingpin_angle vs “wheel_jounce”#
fig, ax = plt.subplots()
ax.plot( wheel_variables["wheel_jounce"], wheel_variables["kingpin_angle"], 'g-', linewidth=2.0)
ax.grid(color='k', linestyle='-', linewidth=0.3)
ax.set_xlabel('wheel jounce')
ax.set_ylabel('kingpin angle')
ax.set_title('Wheel Jounce - Kingpin Angle')
plt.show()
last_meshes = []
def plot_frame(plotter, data, index=None):
global last_meshes
if index is None:
index = data["index_reference"]
upper_control_arm, lower_control_arm, direction, wheel_center, spring_o , push_rod, rocked_o = whisbone_cad_configuration_2(data,index)
wheel = wheel_cad(data, wheel_variables, index)
# Remove the last meshes
for mesh in last_meshes:
plotter.remove_actor(mesh)
# Add new meshes
last_meshes = [
plotter.add_mesh(wheel_center, color="black"),
plotter.add_mesh(upper_control_arm, color="blue"),
plotter.add_mesh(lower_control_arm, color="pink"),
plotter.add_mesh(direction, color="green"),
plotter.add_mesh(wheel, color="black", opacity=0.5),
plotter.add_mesh(spring_o, color="red"),
plotter.add_mesh(spring_o, color="red"),
plotter.add_mesh(push_rod, color="black"),
plotter.add_mesh(rocked_o, color="yellow"),
]
plotter = pv.Plotter()
def create_mesh(value):
res = np.abs(solution["wheel_center"][:,2] - value).argmin()
plot_frame(plotter, solution, index=res)
plotter.add_slider_widget(create_mesh,
rng=[solution["wheel_center"][0, 2], solution["wheel_center"][-1, 2]],
value=solution["wheel_center"][solution["index_reference"]][2],
title='Jounce')
plotter.show()
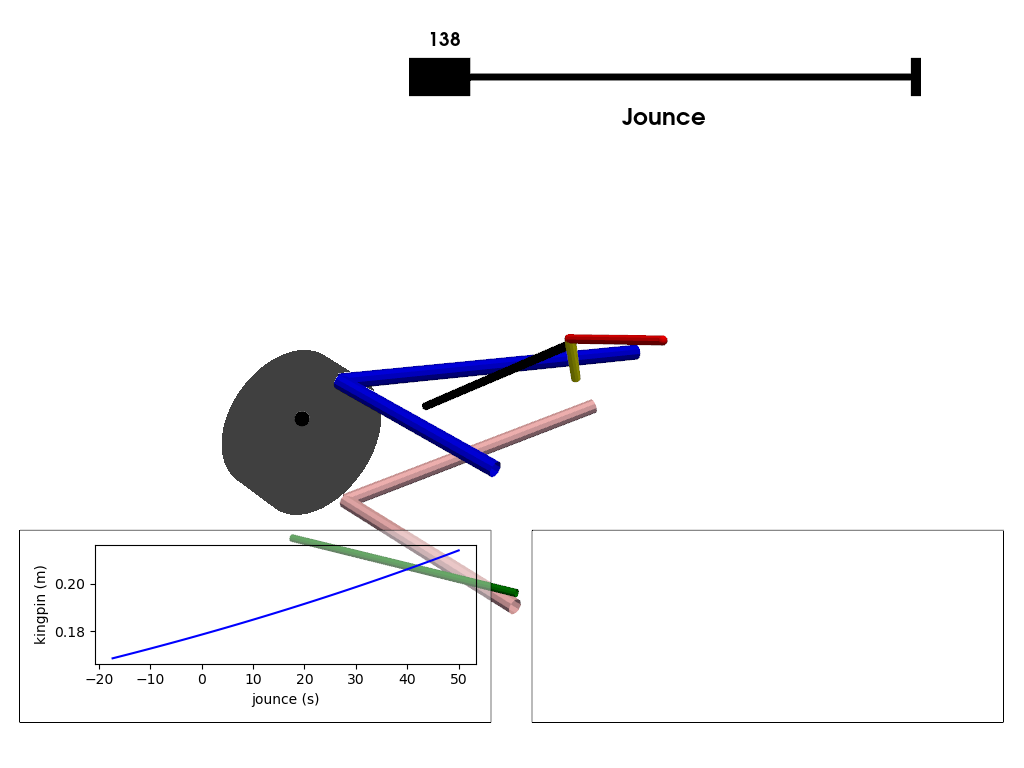
# Global to store last added meshes (e.g., control arms, wheel, etc.)
last_meshes = []
def create_mesh(value):
# Find the closest index based on the wheel_center's Z position
res = np.abs(solution["wheel_center"][:, 2] - value).argmin()
# Plot the frame using the found index
plot_frame(plotter, solution, index=res)
# Get the corresponding jounce value and the kingpin angle
jounce_value = wheel_variables["wheel_jounce"][res]
kingpin_angle = wheel_variables["kingpin_angle"][res]
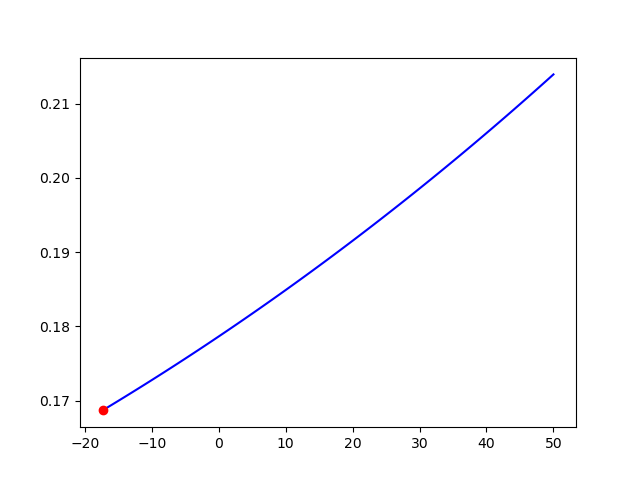
# Clear the previous points on the Matplotlib plot and re-plot the line
ax.clear()
ax.plot(wheel_variables["wheel_jounce"], wheel_variables["kingpin_angle"], label="Kingpin vs Jounce", color='blue')
# Plot only the current point on the graph
ax.scatter(jounce_value, kingpin_angle, color='red', zorder=5) # Plot the point on the chart
# Redraw the plot to update the point
plt.draw()
# Initialize the plotter
plotter = pv.Plotter()
# Create the mesh based on the jounce (slider position)
plotter.add_slider_widget(create_mesh,
[solution["wheel_center"][0, 2], solution["wheel_center"][-1, 2]],
value=solution["index_reference"],
title='Jounce')
# Create a Matplotlib chart for visualization
f, ax = plt.subplots(tight_layout=True)
ax.plot(wheel_variables["wheel_jounce"], wheel_variables["kingpin_angle"], label="Kingpin vs Jounce", color='blue') # initial plot
ax.set_xlabel('jounce (s)')
ax.set_ylabel('kingpin (m)')
# Create the PyVista chart and add it to the plotter
h_chart = pv.ChartMPL(f, size=(0.46, 0.25), loc=(0.02, 0.06))
h_chart.background_color = (1.0, 1.0, 1.0, 0.4)
plotter.add_chart(h_chart)
# Create and add the second 2D chart
v_chart = pv.Chart2D(
size=(0.46, 0.25), loc=(0.52, 0.06), x_label="Time (s)", y_label="Velocity (m/s)"
)
plotter.add_chart(v_chart)
# Show the plot
plotter.show()

Total running time of the script: (0 minutes 1.064 seconds)