Note
Go to the end to download the full example code.
Chassis Visualization Example#
This example demonstrates how to use the pyMyCar package to create and visualize different car chassis models. The chassis is the main structural component of a vehicle, supporting the body and other parts.
The code below shows how to: - Import and use predefined chassis models from pyMyCar. - Visualize these models in 3D with PyVista, including the reference coordinate axes. - Compare different chassis designs by rendering them in separate windows.
Import necessary libraries#
import numpy as np
import pandas as pd
import pyvista as pv
Import from pymycar package#
from pymycar.Cad.Chassis import formula, tourist
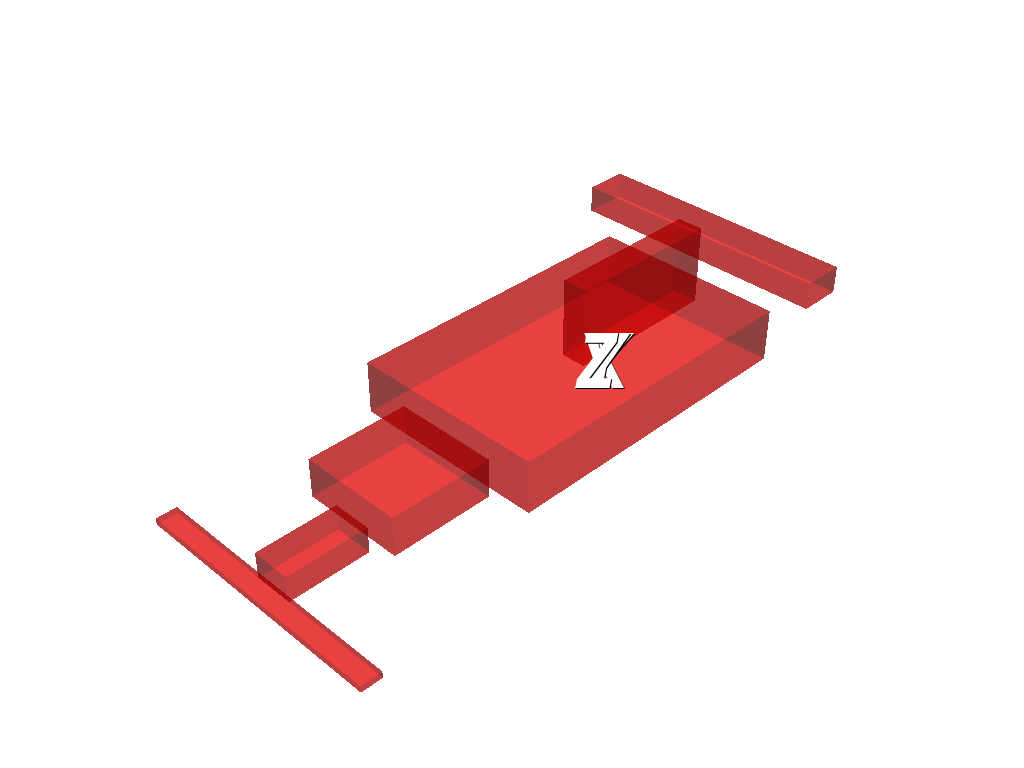
Formula#
Model A
chassis_formula_A = formula.model_A(front_axle_to_com=1500,
            rear_axle_to_com=1645*0.5,
            front_track=1500*0.5,
            rear_track=1645*0.5,
            com_height=400.0,
            roll=0,
            pitch=0,
            yaw=0,
            x=0,
            y=0,
            z=0)
Define the specific point location for the reference coordinate system
reference_point = np.array([0, 0, 400])

plotter = pv.Plotter()
plotter.add_mesh(chassis_formula_A, color="red", opacity=0.5)

axes = pv.Axes()
axes.axes_actor.z_axis_shaft_properties.color = (0.0, 1.0, 1.0)
axes.axes_actor.shaft_type = axes.axes_actor.ShaftType.CYLINDER
plotter.add_actor(axes.axes_actor)

plotter.show()
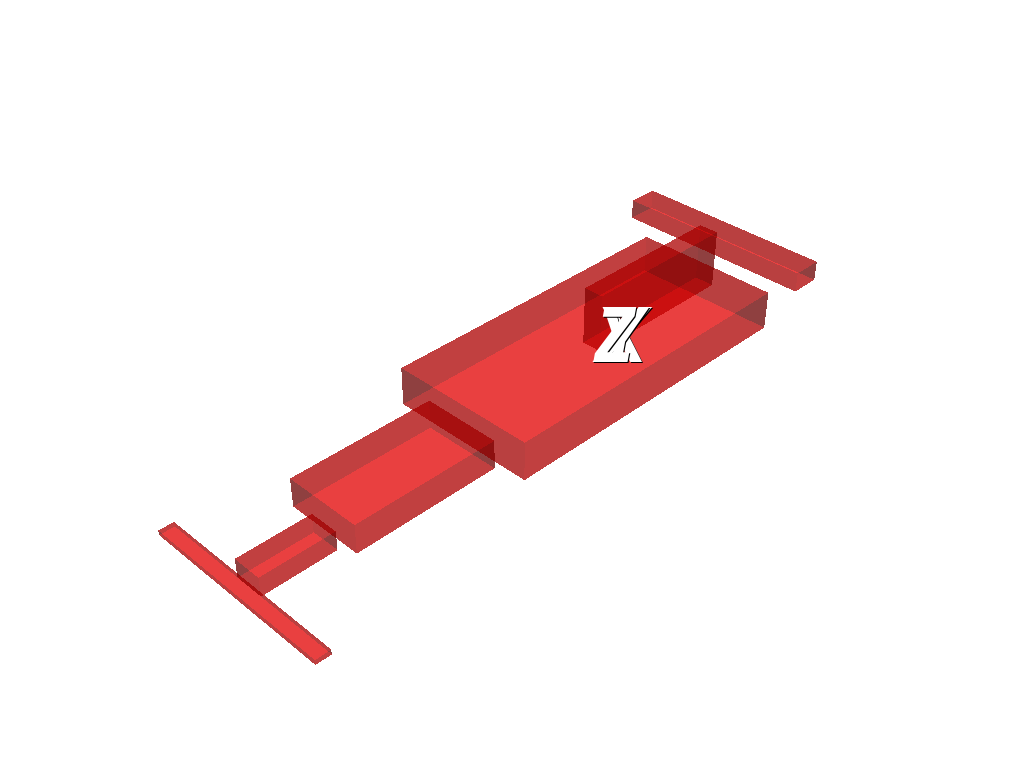
Model B
chassis_formula_B = formula.model_B()

plotter = pv.Plotter()
plotter.add_mesh(chassis_formula_B, color="red", opacity=0.5)
plotter.add_actor(axes.axes_actor)

plotter.show()
Tourist#
chassis_tourist_A = tourist.model_A()

plotter = pv.Plotter()
plotter.add_mesh(chassis_tourist_A, color="red", opacity=0.5)
plotter.add_actor(axes.axes_actor)

plotter.show()

Total running time of the script: (0 minutes 2.261 seconds)