Note
Go to the end to download the full example code.
Geometry Basic Forms#
This example demonstrates how to create and visualize basic geometry forms using the pyMyCar CAD module.
from pymycar.Cad import simple_tube, control_arm, simple_cylinder, simple_sphere, spring, rocked
import numpy as np
import pyvista as pv

# Coordinates for different components of the model
data = {
    "UCA_FRONT": np.array([586.7, -314.5, 199.9]),
    "UCA_REAR": np.array([930.7, -230.2, 244.2]),
    "LCA_FRONT": np.array([588.7, -384.2, 76.8]),
    "LCA_REAR": np.array([938.2, -191.2, 62.7]),
    "TIEROD_INNER": np.array([934.2, -192.1, 81.2]),
    "uca_outer": np.array([953.0, -474.2, 272.2]),
    "lca_outer": np.array([934.8, -514.7, 47.9]),
    "tierod_outer": np.array([1027.1, -513.7, 43.6]),
    "wheel_center": np.array([941.5, -580.2, 155.1]),
    "U_SPRING_MOUNT": np.array([831.7, -278.7, 251.2]),
    "l_spring_mount": np.array([849.2, -419.1, 76.4])
}
Creating various parts of the assembly using the functions
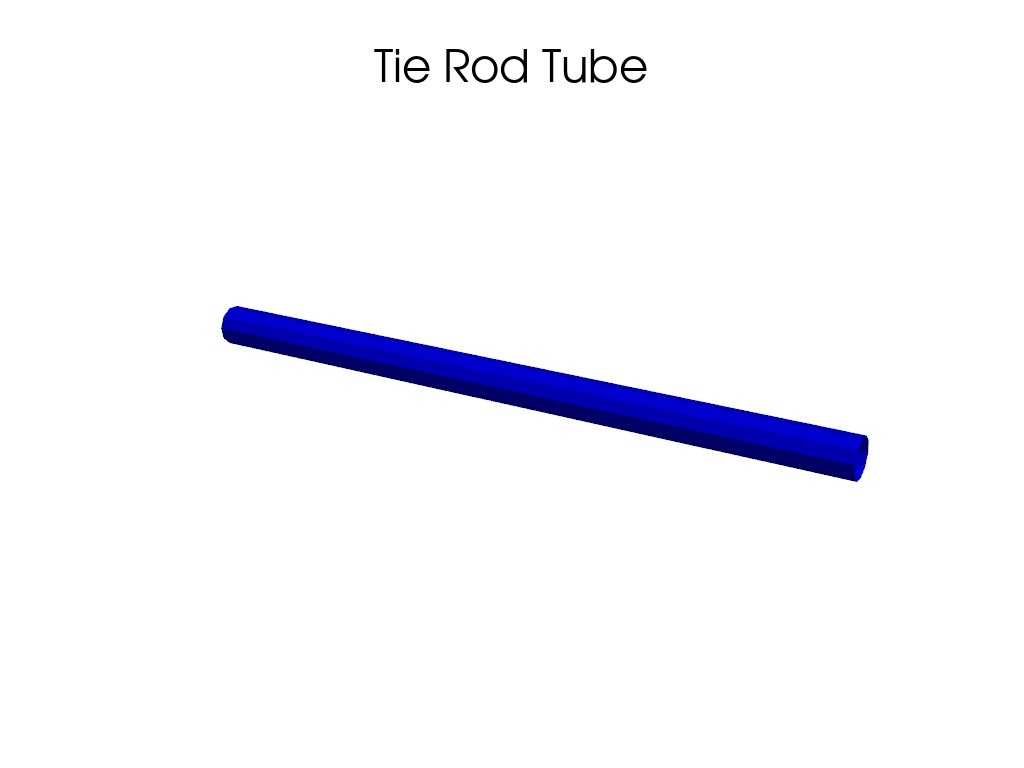
tube = simple_tube(data["TIEROD_INNER"], data["tierod_outer"], radius=10, resolution=100, n_sides=10)
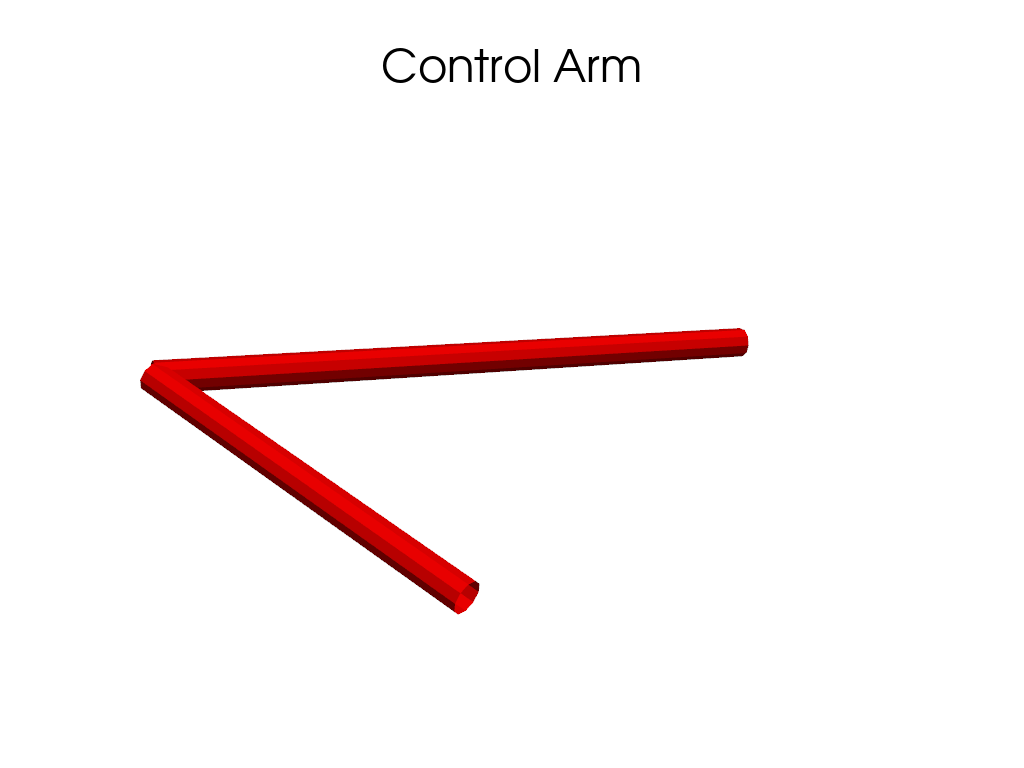
a = control_arm(data["UCA_FRONT"], data["UCA_REAR"], data["uca_outer"], radius=10, resolution=100, n_sides=10)
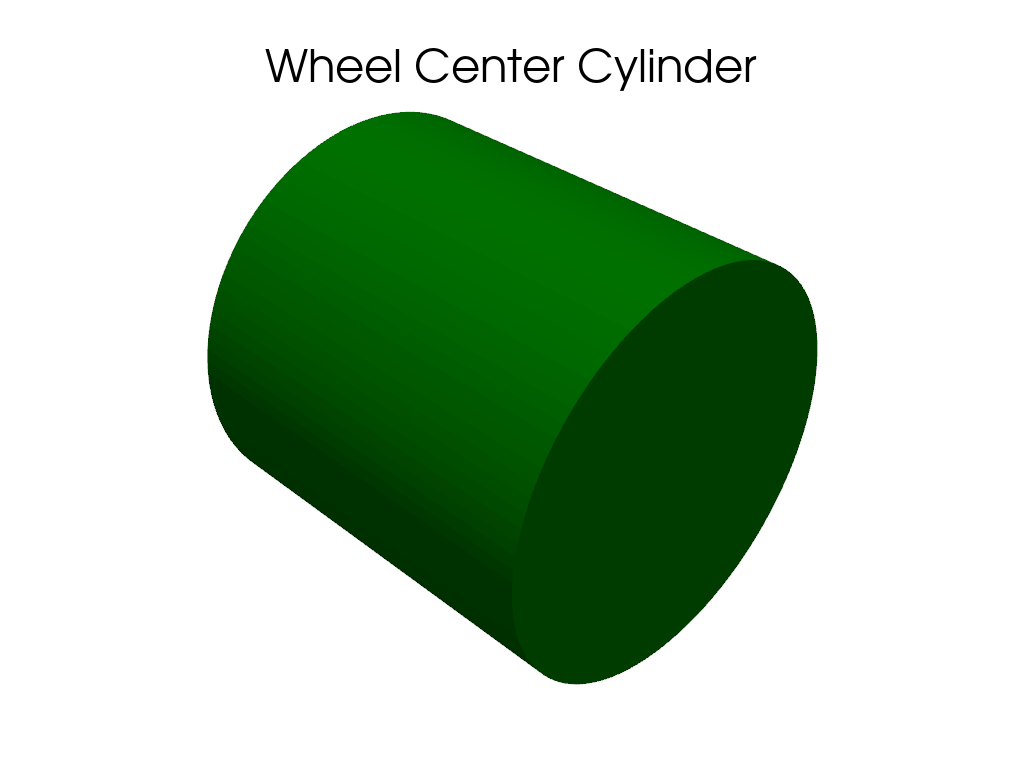
b = simple_cylinder(data["wheel_center"], height=10, radius=5)
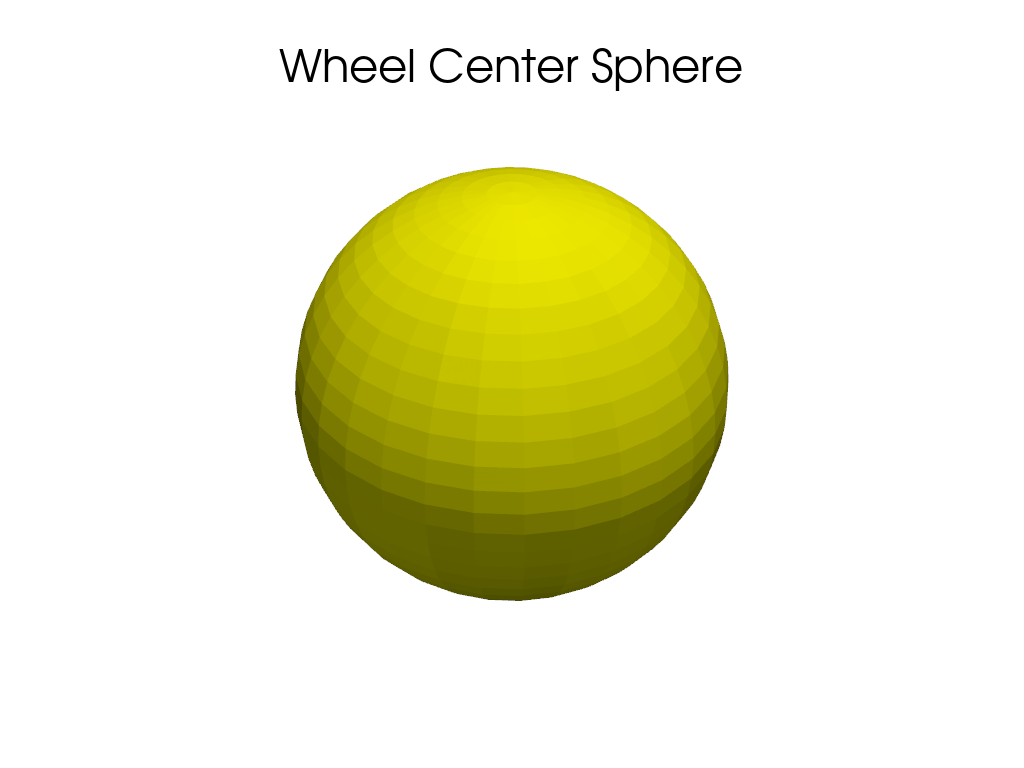
c = simple_sphere(data["wheel_center"], radius=10)
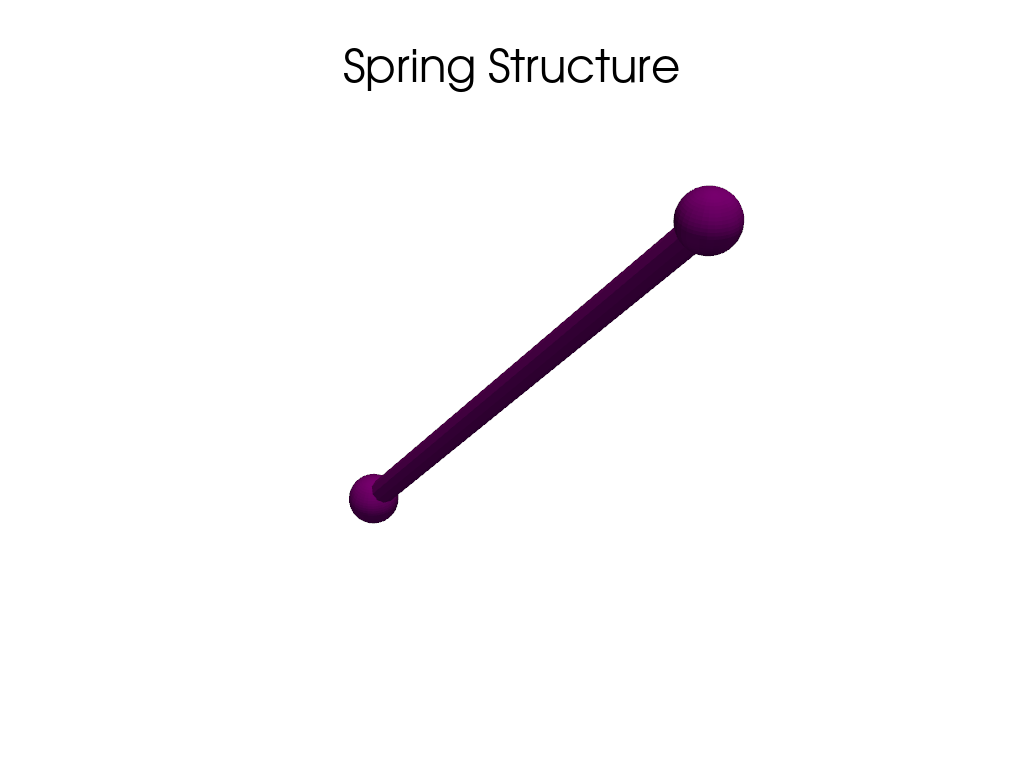
d = spring(data["U_SPRING_MOUNT"], data["l_spring_mount"], radius=10)
Creating a plotter to display the tube
plotter = pv.Plotter()
plotter.add_mesh(tube, color='blue', name="Tie Rod Tube")  # Using blue for tube
plotter.add_title("Tie Rod Tube")  # Adding a title
plotter.show()
Creating a plotter to display the control arm
plotter = pv.Plotter()
plotter.add_mesh(a, color='red', name="Control Arm")  # Red color for control arm
plotter.add_title("Control Arm")  # Adding a title
plotter.show()
Creating a plotter to display the simple cylinder (wheel center)
plotter = pv.Plotter()
plotter.add_mesh(b, color='green', name="Wheel Center Cylinder")  # Green for the cylinder
plotter.add_title("Wheel Center Cylinder")  # Adding a title
plotter.show()
Creating a plotter to display the simple sphere (wheel center)
plotter = pv.Plotter()
plotter.add_mesh(c, color='yellow', name="Wheel Center Sphere")  # Yellow for sphere
plotter.add_title("Wheel Center Sphere")  # Adding a title
plotter.show()
Creating a plotter to display the spring structure
plotter = pv.Plotter()
plotter.add_mesh(d, color='purple', name="Spring")  # Purple for spring
plotter.add_title("Spring Structure")  # Adding a title
plotter.show()
If desired, here is a placeholder for a potential “rocked” structure if needed: plotter = pv.Plotter() plotter.add_mesh(e, color=’cyan’, name=”Rocked Structure”) # Cyan for rocked structure plotter.add_title(“Rocked Structure”) # Adding a title plotter.show()
Total running time of the script: (0 minutes 0.839 seconds)