Note
Go to the end to download the full example code.
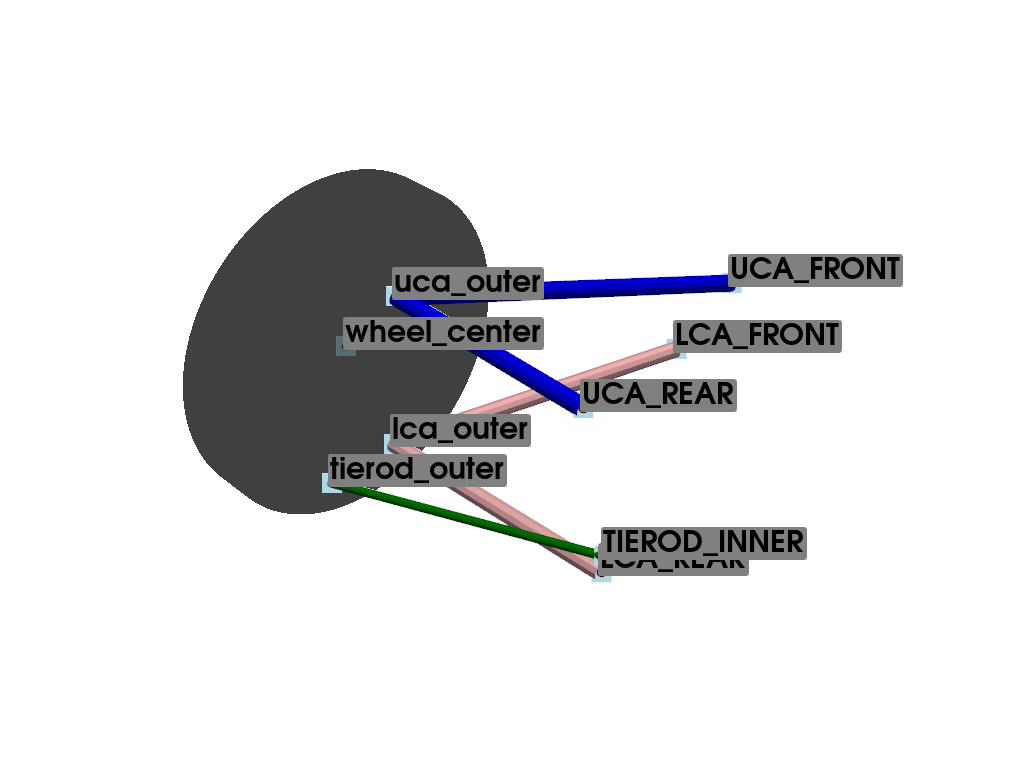
Double Whisbonebase: Base#
#
#                    \\\
#                    \-/
#             UCA_REAR*
#                    /
#                   /
#   -----------    /
#    |       |    /
#    |       |   *----------*UCA_FRONT
#    |       | uca_outer   /⁻\.
#    |       |             ///
#    |       |
#    |       |
#    |       |        tierod_outer
#    |       |       *--------------------*TIEROD_INNER
#    |       |
#    |       |
#    |       |       lca_outer
#    |       |      *------------*LCA_REAR
#   -----------     \           /⁻\.
#                    \          ///
#                     \.
#                      *LCA_FRONT
#                     /⁻\.
#                     ///
Name |
Description |
|---|---|
UCA_FRONT |
upper control arm front |
UCA_REAR |
upper control arm rear |
LCA_FRONT |
upper control arm front |
LCA_REAR |
LOWER control arm rear |
TIEROD_INNER |
tierod inner |
uca_outer |
upper control arm outer |
lca_outer |
lower upper control arm outer |
tierod_outer |
tierod outer |
Import necessary libraries#
import numpy as np
import pandas as pd
import pyvista as pv
Import from pymycar package#
from pymycar.Cad.Suspension.double_whisbone import whisbone_cad_base
Parameters Definition#
data = {
    "UCA_FRONT": np.array([586.7, -314.5, 199.9]),
    "UCA_REAR": np.array([930.7, -230.2, 244.2]),
    "LCA_FRONT": np.array([588.7, -384.2, 76.8]),
    "LCA_REAR": np.array([938.2, -191.2, 62.7]),
    "TIEROD_INNER": np.array([934.2, -192.1, 81.2]),
    "uca_outer": np.array([953.0, -474.2, 272.2]),
    "lca_outer": np.array([934.8, -514.7, 47.9]),
    "tierod_outer": np.array([1027.1, -513.7, 43.6]),
    "wheel_center": np.array([941.5, -580.2, 155.1])
}

upper_control_arm, lower_control_arm, direction, wheel_center1 = whisbone_cad_base(data, None)
wheel = pv.Cylinder(center=data["wheel_center"], direction=(0, 1, 0), height=50, radius=200)

plotter = pv.Plotter()
plotter.add_mesh(upper_control_arm, color="blue"),
plotter.add_mesh(lower_control_arm, color="pink"),
plotter.add_mesh(direction, color="green"),
plotter.add_mesh(wheel, color="black", opacity=0.5)

# Add points to the plot
for name, coord in data.items():
    plotter.add_mesh(pv.Sphere(radius=5, center=coord), color='red')

# Add text annotations
for name, coord in data.items():
    plotter.add_point_labels([coord], [name], point_size=20, font_size=30, text_color='black', always_visible=True)


plotter.show()
Total running time of the script: (0 minutes 0.445 seconds)