Note
Go to the end to download the full example code.
Double Whisbone base#
The kinematics analysis of a double whisbone suspension system is performed in this example. The caracteric curves, as the camber angle, toe angle, wheelbase … as function of the wheel jounce are shown. The suspension geometry is defined by the coordinates of the suspension points.
Note
For more information abaut the double whisbone suspension system, see the explanation in the documentation Double Wishbone Suspension.
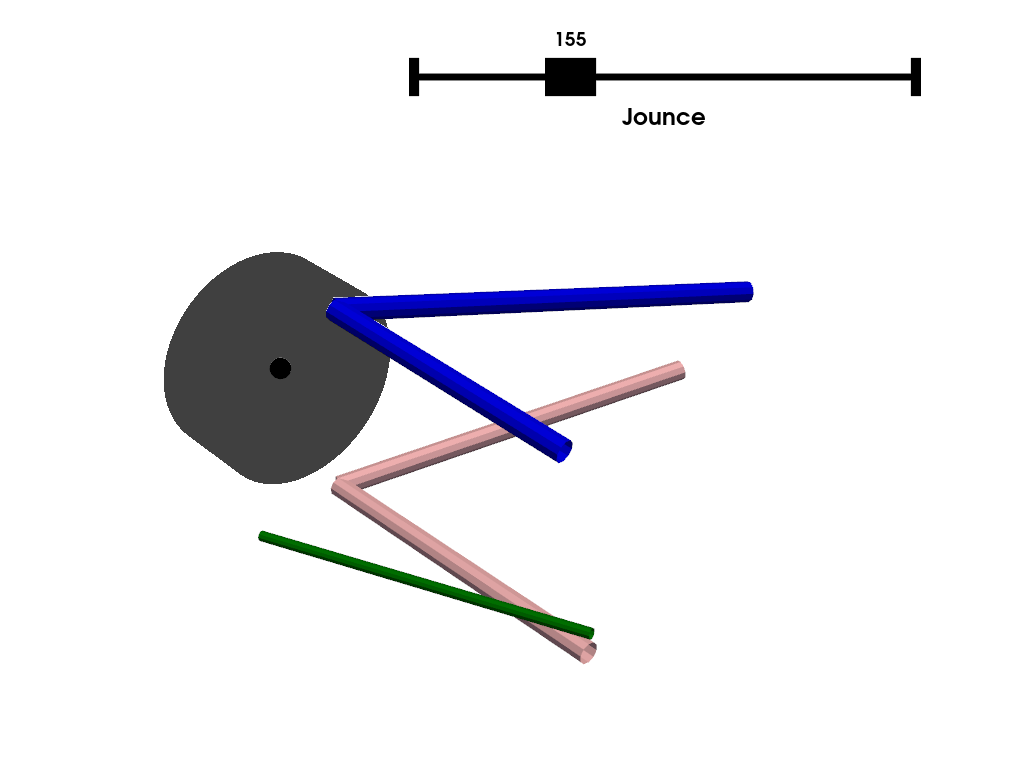
The following grapg represent an esquematic representation of the suspension system. For an interactive detailed view, go to example Double Whisbonebase: Base.
#
#                    \\\
#                    \-/
#             UCA_REAR*
#                    /
#                   /
#   -----------    /
#    |       |    /
#    |       |   *----------*UCA_FRONT
#    |       | uca_outer   /⁻\
#    |       |             ///
#    |       |
#    |  wheel center
#    |   *   |        tierod_outer
#    |       |       *--------------------*TIEROD_INNER
#    |       |
#    |       |
#    |       |       lca_outer
#    |       |      *------------*LCA_REAR
#   -----------     \           /⁻\
#                    \          ///
#                     \
#                      *LCA_FRONT
#                     /⁻\
#                     ///
And a brief description of the variables names:
Name |
Description |
|---|---|
UCA_FRONT |
upper control arm front |
UCA_REAR |
upper control arm rear |
LCA_FRONT |
upper control arm front |
LCA_REAR |
LOWER control arm rear |
TIEROD_INNER |
tierod inner |
uca_outer |
upper control arm outer |
lca_outer |
lower upper control arm outer |
tierod_outer |
tierod outer |
Import necessary libraries#
import matplotlib.pyplot as plt
import numpy as np
import pandas as pd
import pyvista as pv
Import from pymycar package#
from pymycar.SuspensionKinematic.double_whisbone import double_whisbone_base
from pymycar.SuspensionKinematic.functions import get_wheel
from pymycar.Cad.Wheel.wheel import wheel_cad
from pymycar.SuspensionKinematic.suspension_files import load_defined_geometry
from pymycar.Cad.Suspension.double_whisbone import whisbone_cad_base
Parameters Definition#
data = {
    "UCA_FRONT": np.array([586.7, -314.5, 199.9]),
    "UCA_REAR": np.array([930.7, -230.2, 244.2]),
    "LCA_FRONT": np.array([588.7, -384.2, 76.8]),
    "LCA_REAR": np.array([938.2, -191.2, 62.7]),
    "TIEROD_INNER": np.array([934.2, -192.1, 81.2]),
    "uca_outer": np.array([953.0, -474.2, 272.2]),
    "lca_outer": np.array([934.8, -514.7, 47.9]),
    "tierod_outer": np.array([1027.1, -513.7, 43.6]),
    "wheel_center": np.array([941.5, -580.2, 155.1])
}


# file_path = 'data.suspgeo'
# data = load_defined_geometry("double_whisbone_base/input_geometry.suspgeo")
Call the Solver#
solution, wheel_variables = double_whisbone_base(data,
                                max_height_increase=50,
                                max_height_decrease=20,
                                height_step=0.1,
                                save_to_txt=True,
                                result_folder_name="double_whisbone_base",
                                path = None)
All specified files deleted successfully.
All specified folders and their contents deleted successfully.
All specified folders and their contents deleted successfully.
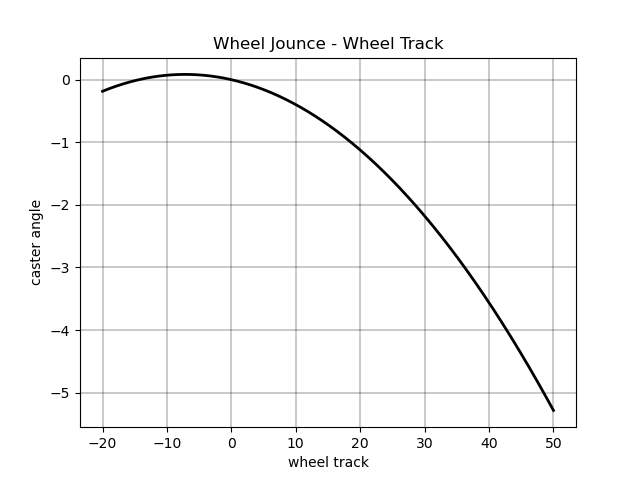
Plot: “wheel_track vs “wheel_jounce”#
fig, ax = plt.subplots()
ax.plot(wheel_variables["wheel_jounce"], wheel_variables["wheel_track"], 'k-', linewidth=2.0)
ax.grid(color='k', linestyle='-', linewidth=0.3)
ax.set_xlabel('wheel track')
ax.set_ylabel('caster angle')
ax.set_title('Wheel Jounce - Wheel Track')
Text(0.5, 1.0, 'Wheel Jounce - Wheel Track')
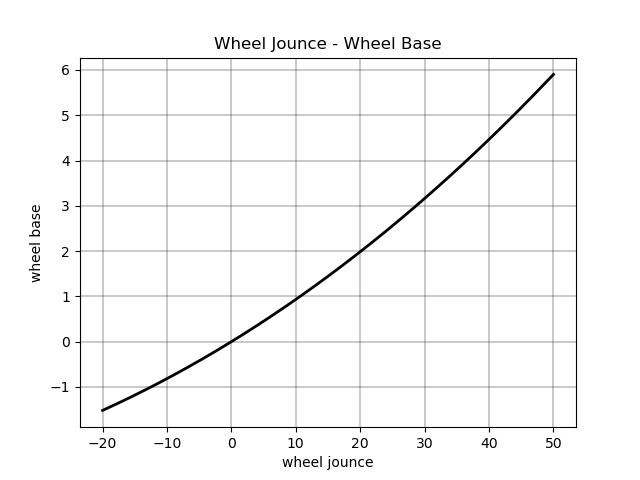
Plot: “wheel_base” vs “wheel_jounce”#
fig, ax = plt.subplots()
ax.plot(wheel_variables["wheel_jounce"], wheel_variables["wheel_base"], 'k-', linewidth=2.0)
ax.grid(color='k', linestyle='-', linewidth=0.3)
ax.set_xlabel('wheel jounce')
ax.set_ylabel('wheel base')
ax.set_title('Wheel Jounce - Wheel Base')
Text(0.5, 1.0, 'Wheel Jounce - Wheel Base')
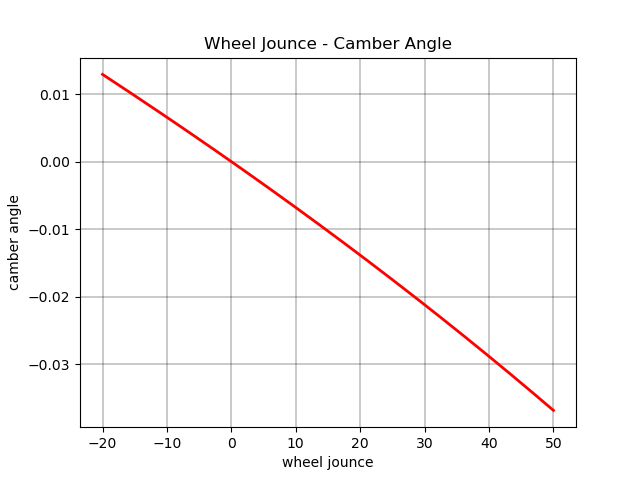
Plot: “camber_angle” vs “wheel_jounce”#
fig, ax = plt.subplots()
ax.plot(wheel_variables["wheel_jounce"], wheel_variables["camber_angle"],'r-', linewidth=2.0)
ax.grid(color='k', linestyle='-', linewidth=0.3)
ax.set_xlabel('wheel jounce')
ax.set_ylabel('camber angle')
ax.set_title('Wheel Jounce - Camber Angle')
Text(0.5, 1.0, 'Wheel Jounce - Camber Angle')
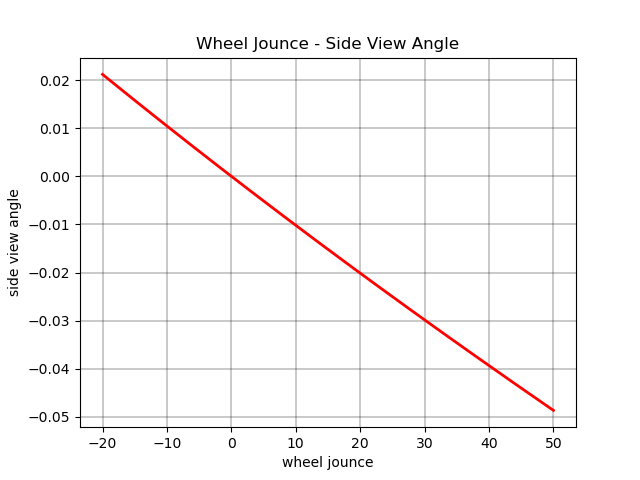
Plot: “camber_angle” vs “wheel_jounce”#
fig, ax = plt.subplots()
ax.plot(wheel_variables["wheel_jounce"], wheel_variables["side_view_angle"],'r-', linewidth=2.0)
ax.grid(color='k', linestyle='-', linewidth=0.3)
ax.set_xlabel('wheel jounce')
ax.set_ylabel('side view angle')
ax.set_title('Wheel Jounce - Side View Angle')
Text(0.5, 1.0, 'Wheel Jounce - Side View Angle')
Plot: “camber_angle” vs “wheel_jounce”#
fig, ax = plt.subplots()
ax.plot(wheel_variables["wheel_jounce"], wheel_variables["toe_angle"],'r-', linewidth=2.0)
ax.grid(color='k', linestyle='-', linewidth=0.3)
ax.set_xlabel('wheel jounce')
ax.set_ylabel('toe angle')
ax.set_title('Wheel Jounce - Toe Angle')
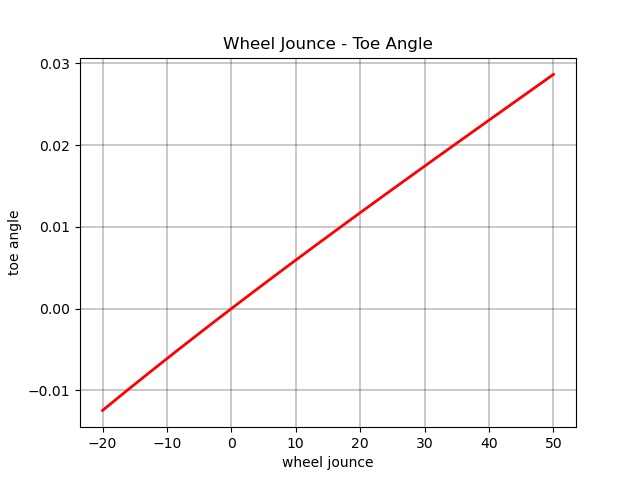
Text(0.5, 1.0, 'Wheel Jounce - Toe Angle')
Plot: “caster_angle” vs “wheel_jounce”#
fig, ax = plt.subplots()
ax.plot(wheel_variables["wheel_jounce"], wheel_variables["caster_angle"], 'g-', linewidth=2.0)
ax.grid(color='k', linestyle='-', linewidth=0.3)
ax.set_xlabel('wheel jounce')
ax.set_ylabel('caster angle')
ax.set_title('Wheel Jounce - Caster Angle')
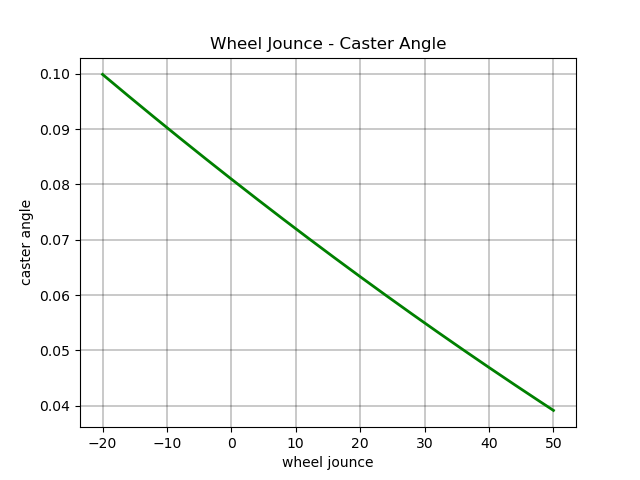
Text(0.5, 1.0, 'Wheel Jounce - Caster Angle')
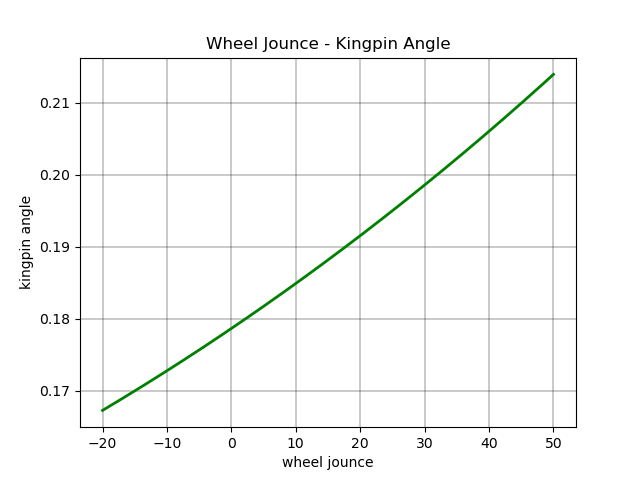
Plot: kingpin_angle vs “wheel_jounce”#
fig, ax = plt.subplots()
ax.plot( wheel_variables["wheel_jounce"], wheel_variables["kingpin_angle"], 'g-', linewidth=2.0)
ax.grid(color='k', linestyle='-', linewidth=0.3)
ax.set_xlabel('wheel jounce')
ax.set_ylabel('kingpin angle')
ax.set_title('Wheel Jounce - Kingpin Angle')

plt.show()


last_meshes = []
def plot_frame(plotter, data, index=None):
    global last_meshes

    if index is None:
        index = data["index_reference"]

    upper_control_arm, lower_control_arm, direction, wheel_center1 = whisbone_cad_base(data,index)
    wheel = wheel_cad(data, wheel_variables, index)

    # Remove the last meshes
    for mesh in last_meshes:
        plotter.remove_actor(mesh)

    # Add new meshes
    last_meshes = [

        plotter.add_mesh(wheel_center1, color="black"),
        plotter.add_mesh(upper_control_arm, color="blue"),
        plotter.add_mesh(lower_control_arm, color="pink"),
        plotter.add_mesh(direction, color="green"),
        plotter.add_mesh(wheel, color="black", opacity=0.5)
    ]


plotter = pv.Plotter()
def create_mesh(value):
    res = np.abs(solution["wheel_center"][:,2] - value).argmin()
    plot_frame(plotter, solution, index=res)

plotter.add_slider_widget(create_mesh,
                          rng=[solution["wheel_center"][0, 2], solution["wheel_center"][-1, 2]],
                          value=solution["wheel_center"][solution["index_reference"]][2],
                          title='Jounce')
plotter.show()
Total running time of the script: (0 minutes 0.621 seconds)