Note
Go to the end to download the full example code.
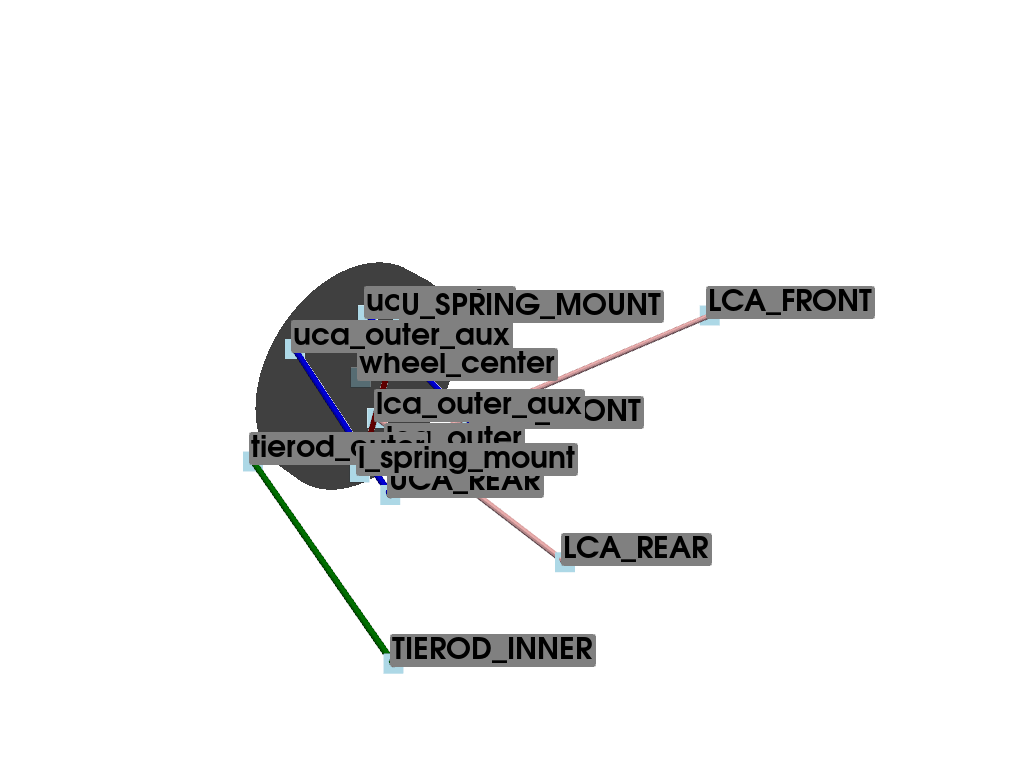
Multilink: Configuration 1#
#
#                    \\\
#                    \-/
#             UCA_REAR*
#                    /
#                   /
#   -----------    /
#    |       |    /
#    |       |   *----------*UCA_FRONT
#    |       | uca_outer   /⁻\.
#    |       |             ///
#    |       |
#    |       |
#    |       |        tierod_outer
#    |       |       *--------------------*TIEROD_INNER
#    |       |
#    |       |
#    |       |       lca_outer
#    |       |      *------------*LCA_REAR
#   -----------     \           /⁻\.
#                    \          ///
#                     \.
#                      *LCA_FRONT
#                     /⁻\.
#                     ///
Name |
Description |
|---|---|
UCA_FRONT |
upper control arm front |
UCA_REAR |
upper control arm rear |
LCA_FRONT |
upper control arm front |
LCA_REAR |
LOWER control arm rear |
TIEROD_INNER |
tierod inner |
uca_outer |
upper control arm outer |
lca_outer |
lower upper control arm outer |
tierod_outer |
tierod outer |
Import necessary libraries#
import numpy as np
import pandas as pd
import pyvista as pv
Import from pymycar package#
from pymycar.Cad.Suspension.multilink import multilink_cad_configuration_1
Parameters Definition#
data = {
    "UCA_FRONT": np.array([4707.1, -462.7, 1120.5]),
    "UCA_REAR": np.array([4912.2, -418.5, 1128.2]),
    "LCA_FRONT": np.array([4066.2, -498.8, 1015.7]),
    "LCA_REAR": np.array([4682.3, -285.2, 936.4]),
    "TIEROD_INNER": np.array([5042.5, -272.4, 988.7]),
    "uca_outer": np.array([4701.2, -710.5, 1207.3]),
    "lca_outer": np.array([4687.4, -698.2, 927.5]),
    "tierod_outer": np.array([4942.9, -719.8, 1038.2]),
    "wheel_center": np.array([4682.2, -766.1, 1047.4]),
    "U_SPRING_MOUNT": np.array([4797, -518.1, 1325]),
    "l_spring_mount": np.array([4789, -649.0, 968.7]),
    "uca_outer_aux": np.array([4840.7, -721.2, 1202.8]),
    "lca_outer_aux": np.array([4702.5, -701.7, 1006.2]),
    "U_SPRING_MOUNT": np.array([4789.0, -518.50, 1325.7]),
    "l_spring_mount": np.array([4789.0, -648.80, 968.7])
}


upper_control_arm, lower_control_arm, upper_control_arm_aux, lower_control_arm_aux, direction, wheel_center1, spring_o = multilink_cad_configuration_1(data, None)
wheel = pv.Cylinder(center=data["wheel_center"], direction=(0, 1, 0), height=50, radius=200)

plotter = pv.Plotter()
plotter.add_mesh(upper_control_arm, color="blue"),
plotter.add_mesh(lower_control_arm, color="pink"),
plotter.add_mesh(upper_control_arm_aux, color="blue"),
plotter.add_mesh(lower_control_arm_aux, color="pink"),
plotter.add_mesh(direction, color="green"),
plotter.add_mesh(spring_o, color="red")
plotter.add_mesh(wheel, color="black", opacity=0.5)

# Add points to the plot
for name, coord in data.items():
    plotter.add_mesh(pv.Sphere(radius=5, center=coord), color='red')

# Add text annotations
for name, coord in data.items():
    plotter.add_point_labels([coord], [name], point_size=20, font_size=30, text_color='black', always_visible=True)


plotter.show()
Total running time of the script: (0 minutes 0.307 seconds)